Updated: Category: Architecture
Architects like me (endearingly referred to as “grumpy old folks”) have seen several generations of programming abstraction come and often also go. Perhaps the most successful abstraction were compilers, originating from the 60s and 70s (before my time!). CASE tools received a lot of attention in the 1990s, followed by Model Driven Architecture and Executable UML in the early 2000s. A few years later and extending into the early 2010s were frameworks like J2EE, the Spring Framework, or Rails, which didn’t provide language abstraction but libraries that take care of much routine coding for applications. More recently Low Code/No Code are the new contender for higher-level abstractions that are intended to appeal to citizen programmers.
After the initial success with compilers, a kind of “programming abstraction winter” seemed to set in with CASE, MDA and Executable UML being relegated to the IT history books as opposed to widespread usage. Low-code tools might bring a much desired spring, but to what extent that’ll happen remains to be seen.
Modern cloud platforms provide us with new and very powerful run-time environments. But the “you can’t build anything in the cloud with less than 10 services” joke is only funny because it’s largely true, especially if you count operational and security services (I conducted my own non-scientific evaluation). It’s becoming clear that building cloud applications could also benefit from higher levels of abstraction. Indeed, “cloud compiler” is a term that starts to pop up now and then. For me, the success of any such effort hinges on a key feature that allowed compilers to be effective: the stack trace.
Programming at higher levels
Elevating programming to higher levels, whether in the cloud or elsewhere, seems natural. After all, without compilers we’d all still be programming in assembly language. And although I have some amount of nostalgia for the 6502 processor that I started programming on (the chip had such a ridiculously small amount of transistors that you can actually build one from discrete transistors), I am not longing to go back to that world (I did a bunch of embedded development for AVR chips back in Japan and GCC was a godsend for that work).
I had described before that good abstractions aren’t easy to find, with many so-called cloud abstractions falling into one of two traps:
- Compositions: constructs that combine lower-level elements but fail to introduce a new language, the prime example being cloud elements like SQS-Lambda-SQS. They are convenient but don’t provide any abstraction as nothing is really being abstracted away.
- Illusions: abstractions that hide too much, including relevant concepts. They lead to initial developer euphoria - things look so much simpler - until reality bites and the illusion bubble bursts (RPC is one of my favorite examples, described in my re:Invent talk on distributed system design.
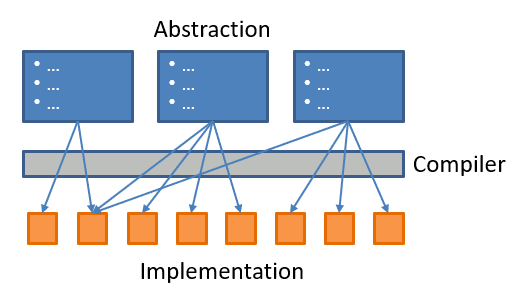
So, the first test a good cloud abstraction has to pass is to actually abstract things without creating dangerous illusions. Such a cloud compiler would allow us to describe our solution at a higher level and deploy lower-level elements on our behalf to make that solution work. Seems simple enough:
And indeed we are seeing numerous frameworks that aim to create a cloud provider- or service-independent layer, partly to achieve portability but also to achieve a higher level of abstractions. DAPR, the Distributed Application Runtime, springs to mind in my domain of distributed cloud applications.
Failure doesn’t respect abstraction
Anyone who has built software for a living knows two things to be true:
- Failure doesn’t respect abstraction
- Failure will happen
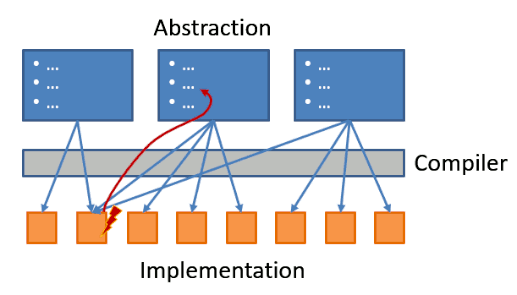
Now things get a bit tricky: the failure occurs in the implementation elements that we abstracted away - after all that’s the run-time. The classic example is a NullPointerException in a language that made us believe that we don’t need to deal with pointers. This can make diagnosing the cause of the failure challenging for two reasons:
- The error can occur in an element you didn’t even know existed.
- The fix has to be made back at the abstract layer, not where it occurred.
So, a translation back from the implementation layer to the abstraction layer is needed:
Following my knack for aircraft (and car) analogies, we could observe the difficulty in debugging a system that you don’t even know exists in two tragic air traffic accidents:
The existence of Boeing 737 MAX’s newly introduced MACS system was abstracted away from the pilots who were left scrambling to stabilize an aircraft that wants to nosedive for no apparent reason.
Luckily as software engineers don’t have to debug at 10,000 ft elevation.
Follow the unhappy path
The unhappy path is where many abstractions struggle. Software that makes building small systems easy but struggles with real-world development scenarios like debugging or automated testing is an unwelcome version of “demoware” - it demos well, but doesn’t actually work in the real world. And there’s no unlock code. This is common enough that in the chapter “Configure This!” in the The Software Architect Elevator I propose the following test for vendors demoing higher-level development systems:
- Ask them to enter a typo into one of the fields where the developer is expected to enter some logic.
- Ask them to leave the room for two minutes while we change a few random elements of their demo configuration. Upon return, they would have to debug and figure out what was changed.
Needless to say, no vendor ever picked the challenge.
The Stack Trace to the rescue
Very few developers wishing themselves back to assembly programming or to coding in a language like Java without any frameworks or libraries is an indicator that these abstractions do work. And it’s unlikely that none of them ever had to debug anything. That’s because two super helpful tools translate problems back to the level of abstraction, the stack trace and the symbol table.
Stack traces show a snapshot of the path (“trace”) that the program took to error location. Not the entire path is shown, but rather the nesting of the methods as in this simple Java example:
java.lang.IllegalStateException: No onEvent(class com.eaipatterns.event.common.EventChannelTest$TestEvent) in class com.eaipatterns.event.common.EventChannelTest$EventRecipientWithoutOnEvent
    at com.eaipatterns.event.common.EventChannel.send(EventChannel.java:44)
    at com.eaipatterns.event.common.EventChannelTest.testSubscribeWithoutMatchingOnEventMethodThrows(EventChannelTest.java:78)
    at java.base/jdk.internal.reflect.NativeMethodAccessorImpl.invoke0(Native Method)
    at java.base/jdk.internal.reflect.NativeMethodAccessorImpl.invoke(NativeMethodAccessorImpl.java:62)
    at java.base/jdk.internal.reflect.DelegatingMethodAccessorImpl.invoke(DelegatingMethodAccessorImpl.java:43)
    at java.base/java.lang.reflect.Method.invoke(Method.java:564)
    at junit.framework.TestCase.runTest(TestCase.java:154)
This stack trace includes a lot of not-very-useful information related to reflection from the JUnit test framework. The net content is that testSubscribeWithoutMatchingOnEventMethodThrows encountered an IllegalStateException at line 44 of the class EventChannel when it called the send method (I removed the part that catches this expected exception to get the stack trace). Over time one gets better at picking out the relevant parts from lengthy stack traces. In any case, the Stack trace is an invaluable tool to understand the context in which the error occurred.
For languages like C that don’t provide a stack trace, the next best thing is a Symbol Table which relates the instruction pointer at the time of the error back to a line of source code. You won’t see the context under which the error occurred. but at least you can see the line of source code that triggered it.
The terrain and the cliff
Making the notion of debugging a system that was generated from abstractions a bit more abstract (ha!), I tend to use the metaphor of the “terrain” that you’re coding on. The shape of the terrain determines your experience once you veer off the happy path, which you invariably will. In The Software Architect Elevator I call the systems that provide poor debugging capabilities:
“Tightrope programming”: as long as you stay exactly on the line, everything is well. One misstep and the deep abyss awaits you.
Receiving no context at all besides a simple “nope” is the worst kind of tightrope because it leaves you entirely clueless as to what happened, which not much recourse except trial-and-error. A customer shared a particularly frustrating version:
In a large enterprise, the infrastructure team wrote tools to inspect deployments and blocked invalid ones. Alas, they provided no error messages whatsoever, leaving developers to just try all variations until something finally deploys.
Such a setup no only wastes time but also leads to undesirable behavior. People will no longer aim for the best design but just try to get something through and never touch it again because it could fail again. Instead of a cliff (or a tightrope) you want a nice plateau with gentle slopes on the edges that you can easily climb back up should you ever slip.
Some of my first steps with serverless were more cliff-like than I would have liked. Messages didn’t get passed through the elements that I had deployed. Was my matching pattern invalid? Was the message format different than I thought? Were IAM permissions lacking (everyone’s first guess)? I had simply too many variables and too few signals. In the end it was a bug in the source code that swapped month and day of the event time stamp that caused no events to be logged after February 2 (the author should have used the strongly typed API instead of creating a string, but that’s how many big stories begin). Finding the root cause took me the better part of a day, making me indeed feel like I fell off the steep cliff surrounding the narrow ridge of serverless enlightenment.
PR/FAQ/ERR?
The cloud deployment example above is typical of many IT projects: we code for the happy path and add useful error messages later when (or rather, if) we have time. After all, users will love our system for the parts that work, not the parts that don’t.
Amazon has many useful mechanisms to not lose sight of the customer need, perhaps best expressed in the infamous PR-FAQ documents. These documents primarily focus on the happy path, which provides value for the customer. Someone walking out from a new type of grocery store (aka “Amazon Go”) surely doesn’t want to see any stack traces. For programming tools or cloud services,in contrast, good error messages can be as important as the main features. Perhaps a section on common errors and how the customer / programmer can detect and resolve them might be a worthwhile addition to those documents?
Don’t make complicated things complex
A lack of signals prevents a user from building a useful mental model of the system they are working with. In one of our amazing Human-Computer Interaction (HCI) classes with Terry Winograd. We were asked to build very simple systems (in HyperCard, iirc. That was low-code development without us even knowing it!) that has a small handful of linear inputs (sliders) and an equal number of outputs. Users were asked to guess the function behind the system by changing the inputs and observing the outputs. It proved nearly impossible even for simple setups.
Dave Snowden isn’t too fond of folks stretching or misapplying his Cynefin Framework, but the lack of signals like stack traces seems analog to move from the complicated to the complex domain. A complicated system has many parts, but you can reason about it and find the one right answer by analysis. Complex systems are emergent and all you can do is probe for more signals. If those signals are weak, you might even drift into chaotic territory where all you can do is act, perhaps randomly, in the hopes of finding the needle in the haystack. Even if the system itself isn’t chaotic, it’ll appear to us as such.
Dave’s article cites an example of a system drifting from complicated to chaotic: Apollo 13. In that case it wasn’t the lack of signals as rather the need to come up with a fix for a sudden issue (an exploding oxygen tank that caused further damage).
Engineers are analytical thinkers. Degrading them to mere probers or, worse yet, random triers, is one of the most frustrating experiences.
Sadly, that’s what systems with insufficient signals do.
Programming without a Stack Trace
Most modern distributed systems don’t actually have a call stack because they communicate via messages as opposed to method calls. Naturally, they also won’t be a stack trace. Some 15 years ago I wrote about Programming without a call stack, but - how about programming without a stack trace?! That’s why distributed tracing is an essential element of building distributed systems. Tools like Dapper or AWS X-Ray and many others fall into this category.
it might seem that message-oriented systems are easier to debug because they have a simple interaction model. However, the opposite is often true. Those systems are distributed, asynchronous, can deliver messages out of order (or not at all–see above), have varying control flows from polling to event streaming, and routinely use soft schemas. Add fine-grained access control on top of that, and it’s not hard to image that you’ll need ample signals to not land in chaotic land.
Observability
Given the difficulty of debugging modern distributed systems like microservices or serverless applications, it’s no surprise that debugging those systems, either during development or during operation has become a major aspect of software delivery. Our friends at Honeycomb have written a nice book about Observability. Derived from control theory, it’s defined as:
Observability is a measure of how well internal states of a system can be inferred from knowledge of its external outputs.
That’s exactly what we need to get back from complex to complicated. If we understand (or infer) the internal state, then figuring out where the problem is becomes much simpler. In my frustrating example above, a warning that messages carry future dates would have shortened the debug cycle from half a day to 10 minutes. The catch is that the types of problems are so diverse that having a warning for every possible error becomes impossible. That’s actually the premise of observability, and the book makes it very clear right at the start:
Modern distributed systems architectures notoriously fail in novel ways that no one is able to predict and that no one has experienced before.
In the absence of a specific alert, we need to debug based on signals. My mental model for this is triangulation used for direction finding. Two directional antennas that can tell the angle that they see an object at can in combination determine the location of the object (this also works in the inverse or based on distances, which is what GPS is based on). So, based on two signals you can infer the state of the system (the position of the boat or aircraft).
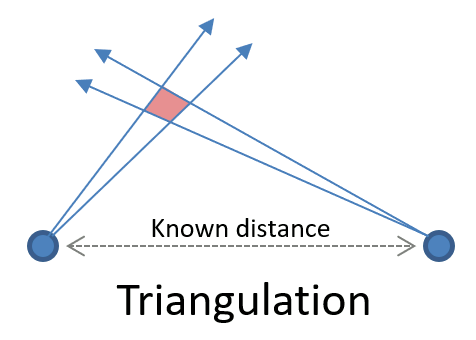
You can easily see that this works better if you have more antennas (a GPS received needs to see 3 satellites plus one for correction) and the finer the resolution is. For example, having the precise angles is going to be much better than just having a quadrant.
The same two factors are the major inputs into observability, as aptly pointed out by the Honeycomb authors: Dimensionality and cardinality. Dimensionality describes the dimensions you have for your data and cardinality how fine-grained that data point is. For example, knowing that a server of a specific model with a specific software version in a specific rack location is operational at a specific time gives us many dimensions but low cardinality (one bit - operational or not). The dimensions can still be very useful as in this (real) example:
A series of servers failing one-by-one that are located in the same rack from bottom to top has a specific cause: fire.
The example also highlights how important the time dimension is. That’s why popular monitoring systems (I grew up with Borgmon, which stood in as the inspiration for Prometheus) are structured as time-series databases (for those inclined, there’s even an on-line Museum of Borgmon Art). Borgmon and Prometheus support dimensionality through labels
In my serverless example above, the presence of one dimension with a single cardinality (message delivered or not) proved an extremely poor starting point for observability. So, even without any additional abstraction, trouble-shooting an event router and a log was difficult enough.
Systemic thinking–hot and cold
The Software Architect Elevator illustrated some of the challenges of troubleshooting systems with the example of my heater. Having moved to a warmer climate since, I am facing similar issues with with my air conditioner who gives unusual readings for the fan coil unit thermistors. Having just two numbers (temp on liquid side and temp on gas side) at hand make diagnosing the issue a difficult guessing game: is it the electronic expansion valve that’s not opening or closing correctly? Over or undercharge? An obstruction? I’ll keep you posted.
Abstractions: yes please, but only with stack trace
When we think about building cloud abstractions, finding suitable abstractions is difficult enough. But even that is only half the story. We also need to find a “stack trace”, a path back from any failure point to determining what to change at he abstraction layer to correct it.
A strategy doesn't come from looking for easy answers but rather from asking the right questions. Cloud Strategy, loaded with 330 pages of vendor-neutral insight, is bound to trigger many questions as it lets you look at your cloud journey from a new angle.
Grow Your Impact as an Architect
The Software Architect Elevator helps architects and IT professionals to take their role to the next level. By sharing the real-life journey of a chief architect, it shows how to influence organizations at the intersection of business and technology. Buy it on Amazon US, Amazon UK, Amazon Europe